Backbone case study
In late 2021, seed-stage supply chain SaaS startup Backbone contacted Kaleidoscope Data about up-leveling their analytics offerings, including offering a paid "Data Warehouse" service to their customers and starting a data practice.
Kaleidoscope Data worked with the CTO and engineering team to build out a scalable analytics infrastructure, grow their data team, and generate revenue from half a dozen enterprise customers for this offering, as well as implementing a framework for growing the team and services with demand.
- Introduction and Background
- The Request
- Requirements for our new Data Warehouse
- Architecture
- Results
- Building a Data Team
Introduction and Background
Backbone is a venture-backed, 40+ person SaaS company. Their current product offering helps cannabis companies manage their manufacturing processes.
Since their inception in 2020, Backbone has focused on the cannabis industry because of how quickly it's growing and how underserved it is. However, the team has visions of scaling horizontally to other industries and vertically to serve all levels of the supply chain. In order to do this, they need to scale their product offering as well as hire aggressively. As a venture-backed organization, they will need to hit serious growth metrics in order attain a larger funding round. Investment in data services for their customers can be one great way to do that.
Currently, customers use Backbone as a system of record in their grow operations to track the various stages of plant production, such as planting, clipping, extracting, sorting, or shipping. At each stage, an operator logs the type of operation they perform, along with the Material or Batch ID, creating a comprehensive dataset of all production at any given time. Furthermore, a "Reports" section of the app is used by operational managers to generate production runs, inventory valuation, and machine history.
The Request
Two things were becoming clear. First of all, the Reports were widely used and requests for new custom reports were frequent. Second of all, there was a dream of expanding the product offering to offer a more nuanced understanding of a supply chain. Vic Patil, CTO of Backbone had this to say:
The problem is when you have all these individuals working at different levels of your supply chain - and they are all generating data but it's stored in different places. We know there's correlation, but we have to do the work of translating it into something more universal so that it can all be seen in the same place. Then, once we've done that, let's actually connect it up with any other disparate sources and see what value can be delivered from it.
What insights can be gained from seeing everything all together?
This concept of translating the data across different sources into something more universal suggests the need of a Data Warehouse. Using it to create understanding across different sections of the organization is a step further but a hypothesis was formed. If we offered each customer their own Data Warehouse, they could use it not only for their own reporting needs, but also to do their own data science and analytics. This could provide a valuable profit-center for Backbone while giving customers a greater understanding of their supply chain and how its various levels interact.
Finally, as with many organizations that capture a lot of data, there were a number of machine learning/predictive modeling ideas. Some examples include:
- Using sales signals to inform cultivators what plants to grow and when
- Helping to ensure good yields by recommending specifics strains at particular times of year
- Improving lead time accuracy for manufacturing particular products
- Predicting machine failures using run history reports
Luckily, work on the data warehouse would help us get closer to being able to start on these projects as well since they would be served by the same data.
The technical context: a working MVP
Back on the ground, Backbone was fielding an ever-growing number of customer requests for custom reports and views on their data. More granular access was needed.
As a first take on a "data warehouse", in-house engineers created a read replica1 of their app database to serve queries from. Metabase enables users to save and share queries so that one power user with adequate knowledge of the app database model can field data report requests, create SQL queries, and distribute the reports to the interested parties. This system provides flexibility and worked well at first, albeit with a few issues.

Issues with the Data Warehouse MVP
This first take was created and managed by overseas contractors hired in the interest of speed and money-saving, but the knowledge-silo was starting to take a toll. The Backbone data model is complex and inherently Tree shaped as it deals with manufacturing data. As in other manufacturing environments, for each stage of the multi-step process, one or more input materials create one or more output materials.
For example, here we see the process by which "Packaged Flower" was produced for one customer:
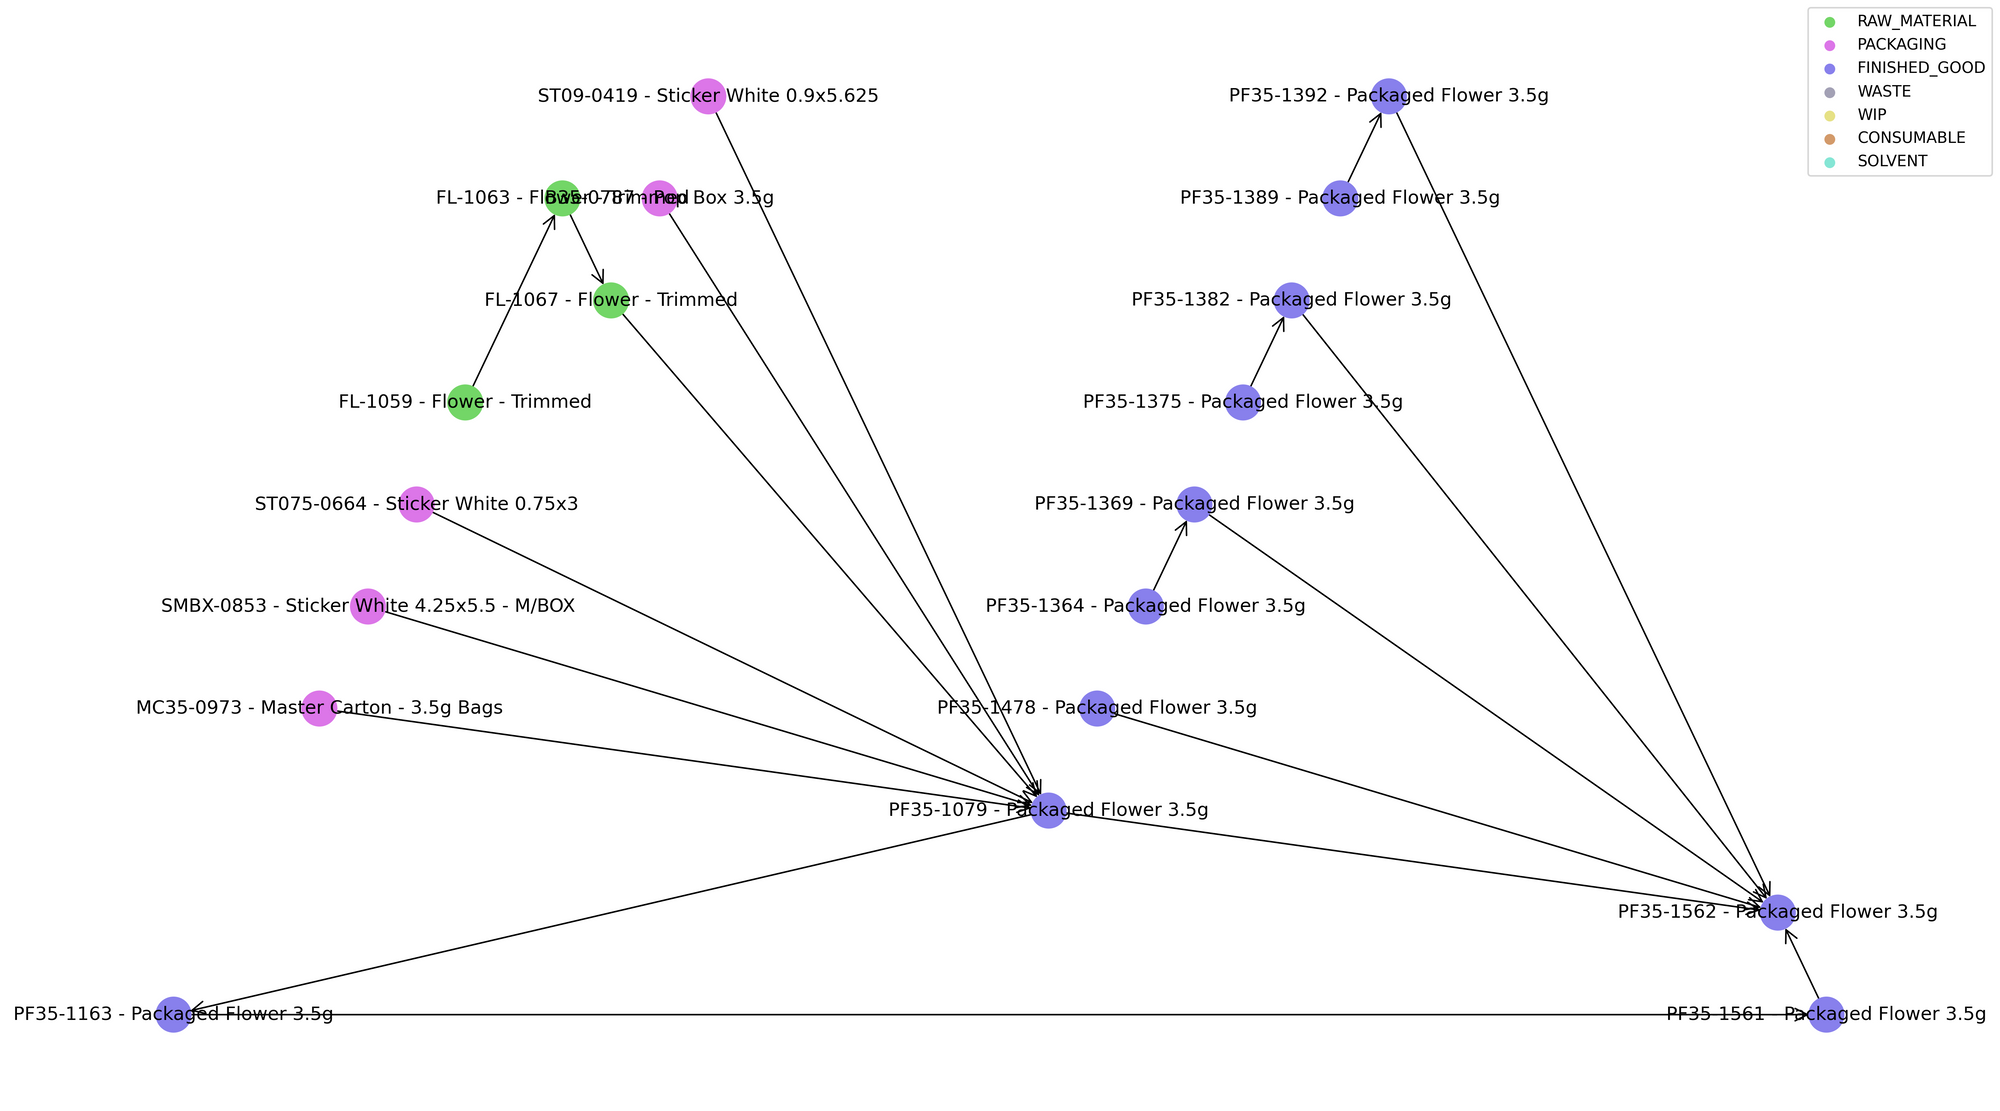
In most cases, operators package the raw material "Trimmed Flower" to create a finished good. However, sometimes operators take the flower out of other bags and repurpose it into a new finished Packaged Flower material. Thus it's not straightforward to determine the exact inputs for any given Packaged Flower and doing so generally involves recursive queries. Now imagine when the production becomes more complex including processes like sorting the flower, creating pre-rolls, edibles, and vape cartridges. Aside from the SQL skill level needed to create them, these queries are also often slow with just a few levels of recursion, even for MPP databases like BigQuery.
Secondly, there was no way for customers to view or edit this data. The existing process again required one power-user to create individualized reports for the customer using Metabase and then distribute them. Administrators could not securely and efficiently provide customers with login access to a Metabase instance. Anyone with a login to an instance can see all the data inside which violates the principle of data isolation in multi-tenant databases.
Generally the MVP had demonstrated demand for more data access and use but was also limiting its growth. A more flexible data pipeline and scalable data warehouse was needed.
Requirements for our new Data Warehouse
When we started at Backbone, we took on the responsibility of both supporting the existing pipeline and also building a new one that could scale to many customers. In order to do the latter, it was important to start with the former to better understand what needed to be changed and what needed to stay.
As we learned about the organization and made use of the old pipeline, we started to form a list of what we wanted out of the new pipeline:
- ELT over ETL - keep transformations in the warehouse itself to better track the data from its source to the report.
- Split out customer data after its been transformed into an analytics schema, not before. This reduces the complexity of the pipeline especially when it scales to many customers.
- Do time consuming or complex queries in the transformation layer whenever possible. Reports should not include recursive queries for instance.
- Distribute to customers the same analytics schema that we use for internal reporting. This not only streamlines development efforts, but also creates a form of dog-fooding that continuously improves our data warehouse offering.
- No customer-specific code. In the interest of scale, adding new customers should require no additional code.
Paid Customer Tiers
As important as our list of desired data warehouse attributes was a list of who would be using it. This helped not only from a product development standpoint but also as the first step in defining data warehouse customer channels in our effort to turn this offering into a profit center.
Of course our data team would be using it internally, but for customer use, we realized that it was helpful to further define 3 customer tiers.
- Tier 1 - Report Access. Access to a standard set of reports that we provide via Metabase.
- Tier 2 - Direct Data Access. Access to all of your data such that you can edit it, create and save your own tables, and integrate with your BI tool of choice or data pipelines.
- Tier 3 - Bespoke services. Anything that is not covered in the first two. This is the most expensive tier as it involves us building custom data products or pipelines specifically for your needs.
Tier 2 was the initial intention for customer data and certainly the most requested. However, in the interest of scaling to many customers and improving our set of pre-built reports, we wanted to encourage Tier 1 usage whenever possible even though it was the cheapest tier. Tier 3 was created to field requests that we were getting for custom work that we couldn't fit into Tier 1 or 2.
Custom Fields
One tricky feature demanded of our data warehouse was the inclusion of custom fields. These fields are a feature of the Backbone app that allows a customer to include specific batch numbers, SKUs, product descriptions, etc. on some tables - basically anything that is not included in the standard app data model.
These fields provide a lot of flexibility for customers but are inherently not generalizable and threaten our goal of no customer specific code. However they are some of the most heavily used data attributes. They are stored in the appropriate app model table as a json field with the following structure
[
  {
    "id": "expiration_date",
    "name": "Exp. Date",
    "type": "date"
  }
]
The values in these fields can be extracted with a json_value query by experience SQL users but in the interest of creating a user-friendly analytics schema, it would be best to extract them ahead of time so that people and BI tools can access them as first-class fields.
StashStock Data Integration
The cannabis industry uses a system called Metrc which tracks cannabis cultivation, production, distribution and sale. Cannabis companies at every stage of the supply chain need to tag all of the goods they are handling with a special unifying Metrc tag so that there is a cohesive record of all the plants that were produced and sold over a period of time.
The Backbone app keeps track of this Metrc tag using a metrc_id field given to every plant that is produced. Some Backbone data customers want to see data regarding plants that were not created in the Backbone app and thus were never given a metrc_id. However these plants do have a Metrc tag tracked by third party systems like StashStock. By importing StashStock data to the data warehouse, we can join in the critical Metrc tag to these plants that were not produced in the Backbone app to provide data customers with a cohesive view of all produced plants.
Architecture
With these requirements in mind, we introduce the architecture we chose to fulfill them. Since Backbone uses Google Cloud Platform for its application infrastructure, we use it again for the data warehouse. Using the same cloud also makes it easier to copy the data from the app to the data warehouse in the first place.
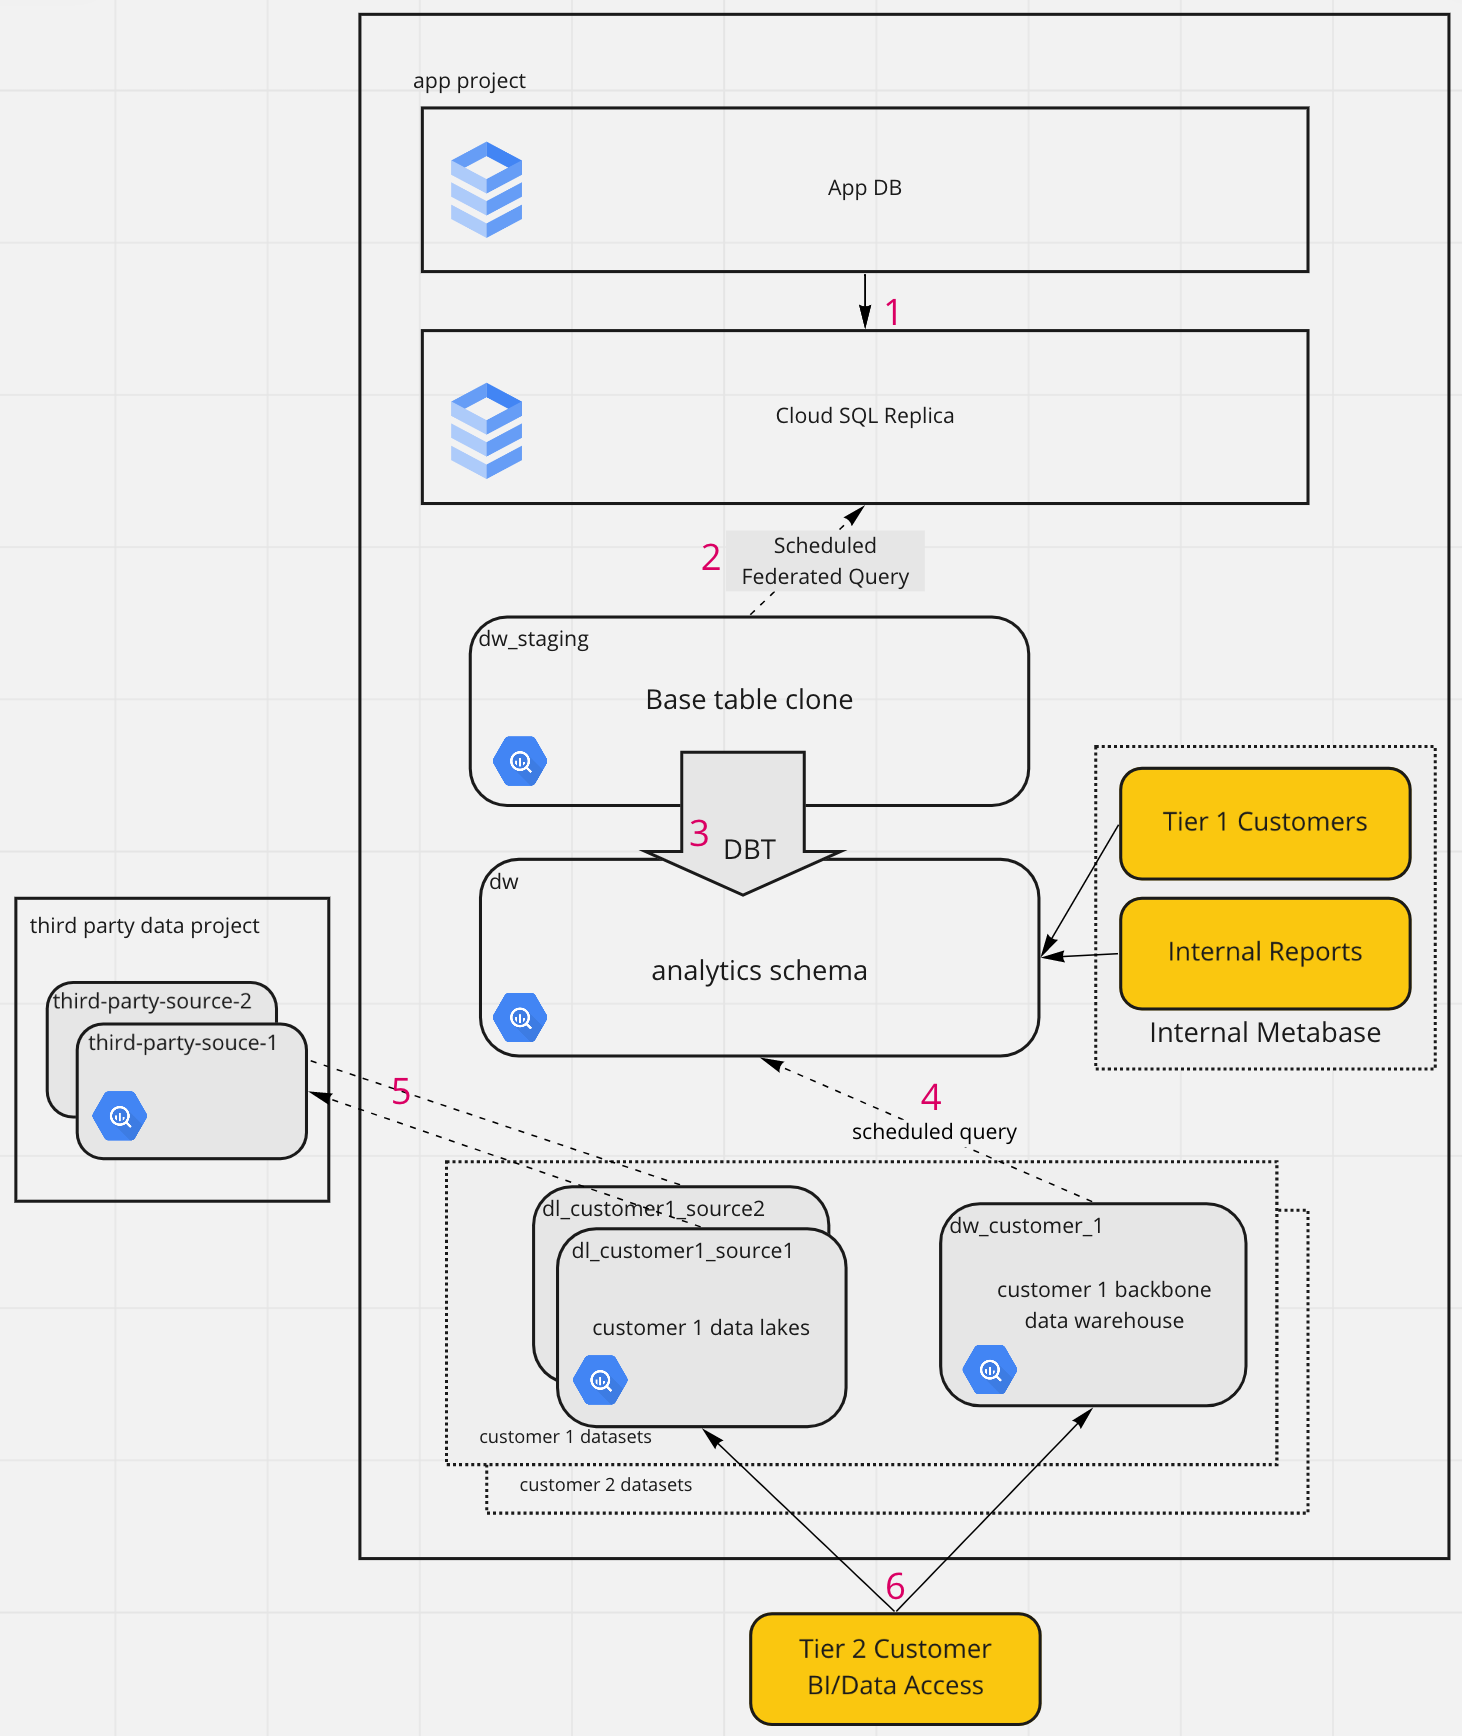
Let's walk through the steps of our new data pipeline and data warehouse by following the steps shown by red numbers.
1. Replication
As mentioned earlier, Backbone was using a read replica of their CloudSQL app database to serve the custom report queries they were making in Metabase. This was the MVP of the data warehouse.
2. Ingestion
In the same project2, we create a base dataset named backbone_prod_db_clone which holds all the base tables of our data warehouse. A federated query runs hourly against the read replica to fill and update these tables
DECLARE TABLE_LIST ARRAY <STRING>;
DECLARE i INT64 DEFAULT 1;
DECLARE cnt INT64 DEFAULT 0;
SET TABLE_LIST = ARRAY(SELECT * FROM EXTERNAL_QUERY("projects/backbone-prod/locations/us/connections/backbone-prod-postgres-sql", """
    SELECT 'CREATE OR REPLACE VIEW backbone_prod_db_clone.' || tt.relname ||
    ' AS SELECT * FROM EXTERNAL_QUERY("projects/backbone-prod/locations/us/connections/backbone-prod-postgres-sql", ' ||
    '"SELECT ' || string_agg(tt.attname END END, ', ') || ' FROM public.' || tt.relname || ';");' AS table_name
    FROM (
            SELECT pc.relname, pa.attname, pa.atttypid, pa.atttypmod, pa.attrelid, pn.nspname
            FROM pg_catalog.pg_attribute pa
                    JOIN pg_catalog.pg_class pc
                        ON pc.oid = pa.attrelid
                            AND pc.relname IN (SELECT table_name FROM information_schema.tables
                                                WHERE table_schema = 'public'
                                                ORDER BY table_name)
                    JOIN pg_catalog.pg_namespace pn
                        ON pn.oid = pc.relnamespace
                            AND pn.nspname = 'public'
            WHERE pa.attnum > 0
            AND NOT pa.attisdropped
            ORDER BY pc.relname, pa.attnum
        ) tt
    GROUP BY tt.nspname, tt.relname, tt.attrelid; """));
SET cnt = ARRAY_LENGTH(TABLE_LIST);
WHILE i <= cnt
DO
EXECUTE IMMEDIATE TABLE_LIST[ORDINAL(i)];
SET i = i + 1;
END WHILE;
By creating VIEWs rather than tables for our base schema, we allow for schema changes in the app database. Now, when schema changes happen, they do cause errors in the pipeline but later down the line where they are all reported and managed by DBT.
3. Transformation
DBT is our preferred tool for data transformations. To use it, you define a series of SQL models, each in a different file, that will transform, join and de-normalize your data to create your analytics/reporting schema. From the order in which you define these models, DBT determines how they have to be created or updated and then creates or updates them. Here is the folder and model structure we are using for our DBT project.
.
├── core
│   ├── material.sql
│   │   ...# core tables used by customers to create reports...
│   ├── transaction.sql
│   ├── reports
│   │   ├── report_production.sql
│   │   ├──...# reports requested and used by customers, created by backbone
│   │   ├── report_sales.sql
│   │   └── schema.yml
├── internal_core
│   └── ...# reports created for internal use...
├── schema.yml
└── staging
    ├── base
    │   ├── backboneiq
    │   │   ├── bb_material.sql
    │   │   ├── ...# backbone app tables
    │   │   ├── bb_machinerun.sql
    │   └── third_party_source
    │       └── ...# third party tables
    ├── purchases_stg.sql
    ├── ...# staging tables built from backbone and third party source tables
    └── user_stg.sql
The models in staging->base->backboneiq represent the app database tables with no alterations. The same thing is true for third party data source tables. From here, these base tables are transformed into the staging tables seen in the staging folder. Some of the transformations here are column name changes or de-normalizing data from multiple models into a single model.
Then these staging models are transformed, joined, etc into the core models which form the basis of the "Data Warehouse". These models represent tables which are used by us to create all internal reports and by customers for their reports - of course with a different set of rows which we will elaborate on further down. Also note a few core internal only tables that contains data that does not apply to customers.
Finally, note the set of core pre-built reports for customers who request them.
We use DBT cloud to schedule and run these transformations hourly. Then our internal and ext that all internal queries are served by this analytics schema as well as Tier 1 customer queries. Tier 1 customers have permissions limited to specific rows using an identifying tenant_id present in every row of every table of the analytics schema - more on this in the next step.
4. Cloning/Filtering
As we have written about previously, one good way to enable multi-tenancy in your data warehouse is to include a tenant_id column in every row. When you do this, you can perform transformations on your internal data warehouse first before splitting it up into tenant or customer-specific clones, meaning that the schema is the same but the rows are filtered down to only those which pertain to that customer. This is what we have done in Backbone's data warehouse as well. Since Backbone is a multi-tenant app, they already have a field for tenant_id in every row which makes this process straightforward. Here is what one of the scheduled queries looks like to clone the data for a specific customer to a customer data warehouse.
DECLARE TABLE_LIST ARRAY<STRING>;
DECLARE DSQL STRING;
DECLARE i INT64 DEFAULT 1;
DECLARE cnt INT64 DEFAULT 0;
DECLARE CUSTOMER_DATASET STRING;

BEGIN
DECLARE drop_statments ARRAY<string>;
DECLARE len int64 default 1;

SET drop_statments = (SELECT ARRAY_AGG( 'drop table ' || table_schema ||'.' || table_name)
                      FROM `CUSTOMER_DATASET.INFORMATION_SCHEMA.TABLES`
                        WHERE table_schema = 'CUSTOMER_DATASET' and table_name like '%'
                    );

WHILE ARRAY_LENGTH(drop_statments) >= len DO
    EXECUTE IMMEDIATE  drop_statments[offset(len-1)];
    SET len = len +1;
END WHILE ;

END;

SET TABLE_LIST = ARRAY(select distinct table_name from dw.INFORMATION_SCHEMA.COLUMNS where column_name='tenant_id');
SET cnt = ARRAY_LENGTH(TABLE_LIST);
WHILE i <= cnt
DO
SET DSQL = 'SELECT * FROM dw.' || TABLE_LIST[ORDINAL(i)] ||' WHERE tenant_id in ( 476 ) '|| '';
  EXECUTE IMMEDIATE 'CREATE OR REPLACE TABLE backbone-prod.CUSTOMER_DATASET.' || TABLE_LIST[ORDINAL(i)] || ' AS '  || DSQL || ';';
  SET i = i + 1;
END WHILE;


CREATE OR REPLACE TABLE backbone-prod.CUSTOMER_DATASET.material AS (

  SELECT
  *
  , JSON_VALUE(custom_fields,'$.strain_code') as custom_field_strain_code
  , JSON_VALUE(custom_fields,'$.tc_loss_reason') as custom_field_tc_loss_reason

  from CUSTOMER_DATASET.material

)
Unfortunately there are a few types of complexity in the app model that makes it difficult to know exactly which rows a customer should be seeing.
- multiple tenants often belong to a single customer
- multiple customers can share a single tenant. This forms a type of a many-to-many relationship.
- Sometimes a customer will need to see just a few parts of a row. If there is a transfer from one tenant to another, the receiving party will need to see some attributes of a row but not others.
There are some tricks we have been using to deal with such complexity. One is to gather upfront a list of material ids that belong to a certain tenant - that way any row which references this material id is included in the customer data warehouse.
This process always has involved writing a custom SQL query to filter out customer data which means new code written for each new customer. Encouragingly, there is nothing about this process which is specific to the customers which indicates that the tenant_id simply needs to be supplemented with something like data_customer_id at which point we could again filter customer data without code changes. This is noted as todo item number 1 near the end of this article.
5. Third Party Data Lakes
As mentioned earlier, one of our requirements is the inclusion of StashStock Metrc Data. This is just one example of several sources of third party data that a customer may wish to see alongside their backbone data warehouse data. For each source of customer third party data, we create a separate data lake dataset, entitled dl_<customer name>_<source name>. This way, we alphabetically group all data lakes vs data warehouses as well as group all data lakes for a specific customer together. Each customer has only 1 backbone data warehouse dataset but perhaps several data lakes all from different sources.
Notice that we keep all third party data in a separate project project from our Backbone app project. This project is generally accessed by very few people or service accounts - only the ones involved in ingesting the third party data to begin with, and scheduling queries from the main app project into the customer data lakes. This means that the permissions involved are very different from the main app project which has a complex combination of internal employees and customers accessing various resources. We have found it helpful to maintain this project separation to avoid polluting the resource and permissions space.
Also note that there is a different dataset for each third party data source, StashStock being the first of many. Each dataset contains all customer data for that source. Then for each customer data lake, a scheduled query is in charge of selecting only the rows that apply to that customer from the global dataset. The data is thus split between customers in exactly the same way that the backbone data warehouse data is split up which means that the same requirement of a tenant id for each row applies here as well.
The process to ingest data to the third party dataset differs from source to source. In some cases it is dumped with a flat CSV or JSON file and in other cases like for StashStock, it is continuously ingested using a combination of cloud run, cloud storage, and the BigQuery data transfer service.
6. Customer BI Tools
Since all customer data is now siloed in customer datasets entitled dw_<customer name> and dl_<customer name>_<source name>, it's a simple matter to create customer specific service accounts and grant each one access to their datasets. The service account key file for this service account can then be used in their BI tool of choice for direct access to read/write/update the data in this dataset.

Documentation
Though its not shown in the diagram, documentation of our analytics schema is an important part of our offering. This acts as a specification for the data available to an analyst - its also been called a data catalog. We decided to use DBT's documentation as a first step. One very cool feature of this is the lineage diagram.
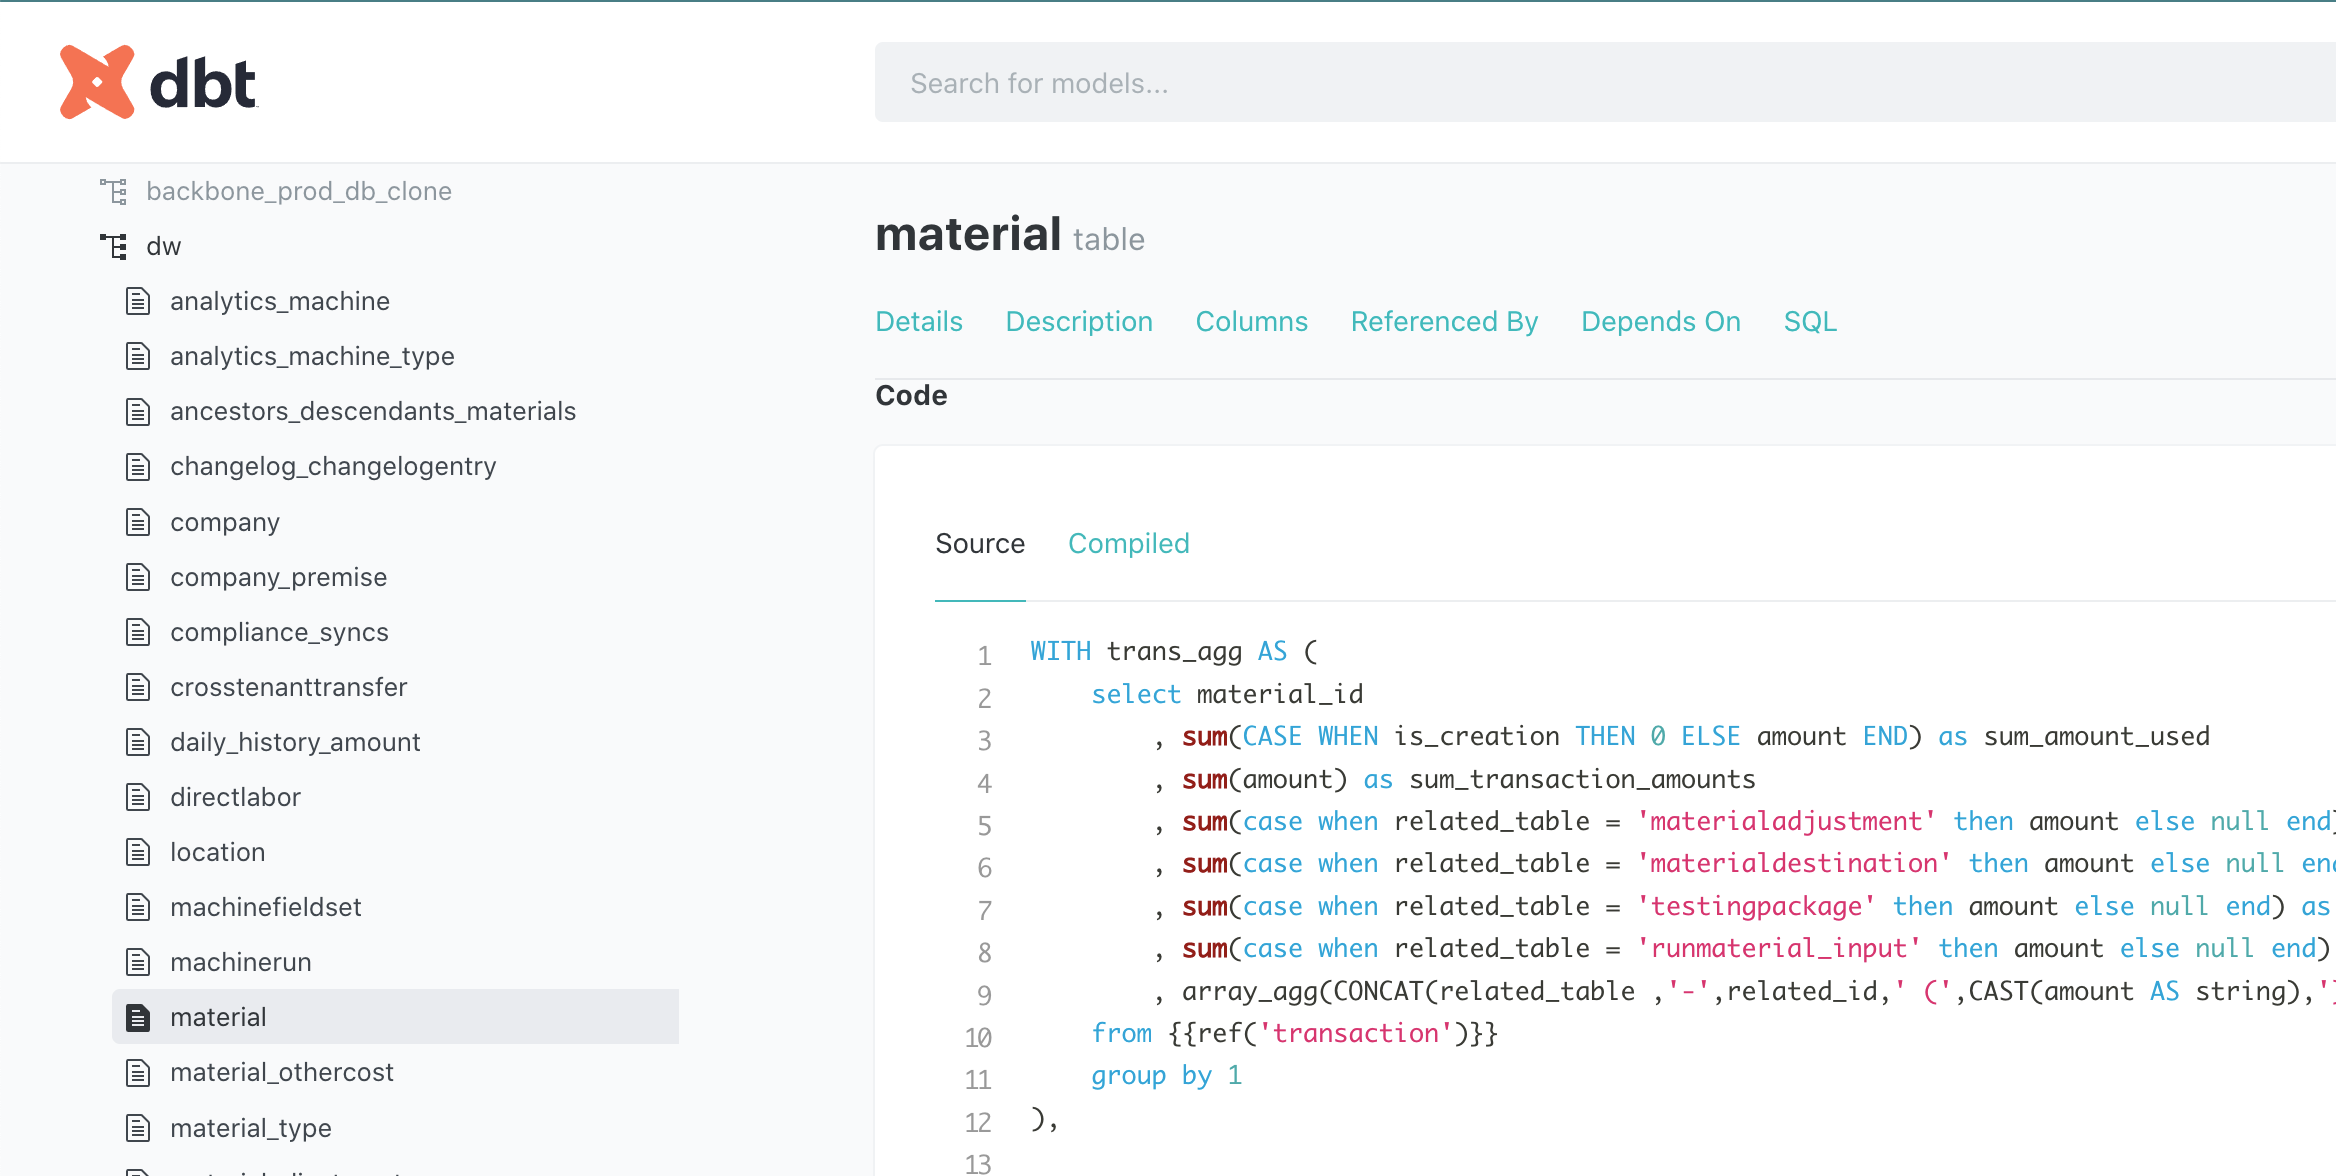
Here we are shown the query that was used to create the Material table. It not only gives insight as to what each of the columns in the table really mean but also guidance on how an analyst might build their own Material table if this one isn't adequate.
This data cataloging is a critical first step towards a better understanding of available data both internally and for customers.
Results
As of writing this, we are 6 months into working with Backbone. We have helped to build out the infrastructure described above and are using it with five different customers. Vic Patil, Backbone CTO had this to say
One thing I would say is that the upleveling that we talked about really started to happen. People had the interest already, but you helped them connect the dots in transitioning to a more data-informed skillset while leveraging their cannabis industry expertise.
Outcomes and benefits attained included:
- Data team established. We have scaled the efforts of the data team from those of a single person to those of a team. Not only has the company gained a larger understanding of data as a result of our collaboration but several Backbone employees have started the journey from Cannabis industry expert to data/analytics engineer.
- From "cost center" to "revenue generator." Backbone now has 5 paying customers that use the external-facing data warehouse to create their own reports. Some are using our pre-built reports, others are using our analytics schema and documentation to create their own.
- Per-tenant customization. Customers are able to see their custom fields in their data warehouse
- Third-party data available to customers. Third Party Metrc Stashstock data is available and continuously integrated for all customers who have signed up for it.
- Unified internal/external analytics. Backbone shares the same analytics schema between internal and external customers, streamlining development and dog-fooding their data warehouse.
- Ease of use improvements. We added many helpful fields to the analytics table to make report creation easier such as a list of all ancestors and descendants for each material
- Easy onboarding. Each customer signup requires very little new code which help Backbone scale quickly.
- Simplicity. Less complexity in creating reports since we do all the complex stuff ahead of time in DBT.
- Speed. Faster queries, since we do all the recursive stuff ahead of time in DBT and since we have transitioned from Postgres to BigQuery.
Along with these things we were able to accomplish, we also started to form a list of what could be next for Backbone - future projects done in house or contracted out:
- Remove all customer-specific code. Right now the scheduled queries to filter/clone the data warehouse for each customer still contain custom code. Instead the customer configuration including a list of tenant ids, material ids, and custom fields for each table needs to be in a separate table and used by a single scheduled query to replicate all of them (thought it can be run in parallel).
- Testing the pipeline. We have had some cases of customers complaining about NULLs in tables - we should know ahead of time whether this should be possible and why it might be the case. We are interested in using DBT testing and possibly the Great Expectations framework form more granular testing.
- Clarify our understanding of and strategy for customer tiers. Currently every customer we have has opted for tier 2 making tier 1 irrelevant. Tier 1 scales better however so it still may be worth encouraging. Some customers who are on tier 2 may be happy on tier 1 as well. We need more experience to create an appropriate set of options.
- Better app/data warehouse integration. Right now customers are using both in-app reports and data warehouse reports. Not only does this create a source of potential inconsistencies if there are bugs in the transformation layer, but also confusion as to the roles that each play. Ideally if a report is being used frequently, it will be moved into the app but this process is still quite confusing.
- Versioning the data warehouse. As more customers start using our analytics schema in their own reporting pipelines we will need some form of versioning to prevent our changes from breaking people's reports. At the moment we can still manually make changes as needed but soon that will not be the case.
- Consider separating the data warehouse into a separate project as we did with our third party data for the same reasons of de-polluting the resource and permissions space. As mentioned in the footnotes we had trouble creating a scheduled federated query against a CloudSQL instance in a different project so could not do this here. However there may be other ways to ingest the data such as the BigQuery Data Transfer Service.
- Lineage visualization. Because of the ongoing confusion caused by manufacturing data, we have often wanted to use better visualization to help users understand the path that their materials are taking during manufacturing. Though we have made a rough first attempt at this, it still needs to be fleshed out a great deal more.
- Machine Learning. We now have an excellent base from which to do some more exploratory data work including building predictive models that answer some of the questions we started with. For example, using sales signals to inform cultivators what to start growing and when, helping to predict predict low yields for some strains in specific times of year, or improving lead time accuracy for manufacturing particular products.
Building a Data Team
Along with these technical TODOs, we made sure to provide Backbone with a game-plan for a data team that could tackle these projects. This includes the set of roles they would need to hire for and what each person would do specifically on the team. Here is a high level description:
- data analyst - generate insight for clients and internal stakeholders via deep analysis of data.
- data engineer - assemble additional GCP infrastructure for the data warehouse and data pipeline.
- analytics engineer - use DBT to improve the analytics schema for reporting needs.
Vic Patil, Backbone CTO mentioned how useful this type of planning was for him and the rest of the executive team:
Actually building a hiring plan, like with rough ranges of what we’d need to pay, was really great. Knowing roughly: this is the profile of the team that you're going to hire and presenting a plan for what they would be doing was incredibly valuable. It feels like the education process started even from our first discussions - things like "what is a data engineer vs an analytics engineer or a data scientist vs a data engineer." That was really helpful and allowed us to plan and make reasonable judgements on our overall growth plans.
We hope that with this game-plan, the data culture we have started to foster, and the BigQuery data warehouse infrastructure we helped to build out, we have provided Backbone with a solid foundation for continued growth and success.
Footnotes
1 Because it was a read replica, queries wouldn't tax the app database.
2 We put the data warehouse in the same project as the app because we couldn't find a way to create a scheduled federated query to a CloudSQL instance from a different project. This is mentioned as a todo number 6 near the end of the article.